Research and Statistics - Maryland Occupational Safety and Health (MOSH)
Employer-Reported Workplace Injuries and Illnesses in Maryland, 2016
In 2016, a total of 65,500 cases of nonfatal occupational injury and illness was reported by Maryland’s private and public sector employers, based on the latest results from the U.S. Bureau of Labor Statistics’ Survey of Occupational Injuries and Illnesses program. The number of injuries and illnesses reported converts to a total recordable case (TRC) incidence rate of 3.3 injuries and illnesses per 100 equivalent full-time workers. This rate was not statistically different from 2015’s rate of 3.2.
The Survey of Occupational Injuries and Illnesses or (SOII) is a cooperative program between the Maryland Department of Labor, Licensing and Regulation, Division of Labor and Industry and the U.S. Department of Labor, Bureau of Labor Statistics. In 2016 there were approximately 2.5 million workers in the State under the Maryland Occupational Safety and Health (MOSH) agency’s regulatory oversight.1
Maryland’s Private Sector
(see 2016 Maryland Survey Summary in PDF format)
Maryland’s private sector employers reported 48,400 nonfatal injuries and illnesses. The difference in the number of injuries and illnesses reported for 2016 was not statistically different from 2015. Injuries and illnesses in the private sector occurred at a rate of 2.8 cases per 100 equivalent full-time workers. Approximately 96.5 percent of all cases reported in private industry were injuries while cases of occupational illness accounted for approximately 1,700. Cases of a more serious nature involving days away from work, job transfers, or restrictions -- commonly referred to as the DART rate, occurred at a rate of 1.5 cases per 100 full-time equivalent workers. There were 18,600 cases in private industry that were severe enough to require the employee take at least one full day off work for recuperation.
Rates of injury and illness by industry sector ranged from a TRC incidence rate of 0.4 injuries and illnesses per 100 full-time equivalent workers for Management of companies and enterprises (NAICS 55), up to a rate of 6.7 for Arts, entertainment, and recreation (NAICS 71).
Eighty-four percent of the reported injuries and illnesses occurred in the service-providing industries with 40,600 recorded cases while goods-producing industries accounted for 16 percent or 7,800 cases. These injury and illness estimates for Maryland’s private sector covered just over 2.1 million workers, based on the Maryland Department of Labor, Licensing and Regulation’s labor market information and the Quarterly Census of Employment and Wages program.
For 2016, most Maryland industries in the private sector reported TRC rates not statistically different from the previous year with two notable exceptions: Animal slaughtering and processing (NAICS 31161) reported a rate increase to 9.8, up from 7.0 in 2015 and Hospitals (NAICS 622), reporting an increase of 6.2, up from 2015’s rate of 5.9.
Maryland’s private sector TRC rate of 2.8 injuries and illnesses per 100 full-time equivalent workers was not statistically different from the U.S. private sector’s rate of 2.9. Of the SOII program’s 41 participating states and the District of Columbia, private industry rates were higher than the national average in 21 states, lower in 13 states and in the District of Columbia, and not statistically different in 7 states, according to the U.S. Bureau of Labor Statistics’ national SOII press release for calendar year 2016.
Case Circumstances and Worker Characteristics, Maryland Private Industry, 2016
There were approximately 18,600 cases in private industry that were severe enough to require the employee to take time off from work for recuperation. This estimate for the number of days away from work (DAFW) cases is not statistically different from the previous year’s count. Maryland’s private sector incidence rate for DAFW cases was 106.4 cases per 10,000 full-time equivalent workers in 2016. By comparison, the DAFW incidence rate for the United States’ private sector was 91.7 cases per 10,000 workers.
The majority of the DAFW cases were sprains, strains, or tears. These injuries accounted for 38 percent (7,070) of all DAFW cases in the State’s private sector. Other significant causes of injury and illness resulting in days away were soreness, pain (2,990); bruises, contusions (1,960); cuts, lacerations (1,600); and fractures (1,260).
Injuries and illnesses due to overexertion and bodily reaction accounted for 28.9 percent (5,380) of the total DAFW cases. Other leading events in the private sector were contact with objects and equipment with 28 percent (5,210); falls, slips or trips with 25.1 percent (4,660); and transportation events with 8.7 percent (1,620).
A key measure of case severity is the median number of days missed from work that is necessary for the employee’s recuperation. In Maryland’s total private sector, the median number of days missed in 2016 was seven days - as it was in 2015. The U.S. private sector’s medium number of days missed was eight. Maryland’s construction sector (NAICS 23) recorded the highest number of median days away from work in private industry with 15. Additionally, 41.3 percent of these construction industry workers required 31 or more days off for recuperation. Other services, except public administration (NAICS 81), recorded the fewest number of median days away from work with two.
Selected occupations reporting high median days away from work were: automotive body and related repairers (180); first line supervisors of retail sales workers (56); construction laborers (40); heavy and tractor-trailer truck drivers (34); light truck and delivery service drivers (21); cargo and freight agents (17); and carpenters (15).
Based on occupational group, the transportation and material moving occupations reported the most DAFW cases with 4,040. Other occupational groups reporting a significant number of cases were Installation, maintenance, and repair occupations (1,860); Construction and extraction occupations (1,750); Office and administrative support occupations (1,550); Sales and related occupations (1,500); Food preparation and serving related occupations (1,460); Building and grounds cleaning and maintenance occupations (1,120); and Healthcare practitioners and technical occupations (1,090).
Sixty-one percent (11,340) of the days-away-from-work cases involved men; however, the percentage of cases based on gender varied by industry from construction (NAICS 23), where women comprised 1.8 percent of the DAFW cases, to education and health services (NAICS 61-62), where their share constituted 77.7 percent.
White-only workers accounted for 28.8 percent of the cases while Black-only workers represented 20.8 percent. Hispanic or Latino-only workers were identified in 9.5 percent of the total DAFW cases. Race or ethnic origin was not reported in 39.8 percent of the time.
When the day of the week of the injury or illness was reported, Tuesday, for the second consecutive year, was the most hazardous work day in Maryland’s private sector with 19 percent (3,530) of all cases. Tuesday was also the most hazardous workday in the U.S. private sector with 18.1 percent. The most hazardous time of day was between 8:01am and 12 noon with 26 percent (4,830) of the total.
Maryland’s State and Local Government
State and local government collectively reported 17,200 new cases of occupational injury and illness in Maryland during 2016. Over 78 percent of all cases for State and local government were reported in the local government sector. The number of reported cases converted to a TRC rate of 6.5 cases per 100 full-time equivalent workers and represented an 18 percent increase over 2015’s rate of 5.5.
Maryland State government’s TRC rate increased to 4.2 injuries and illnesses in 2016, up from 4.0 the previous year. Maryland state government’s TRC rate was 13.5 percent above the all U.S. local government TRC average of 3.7 cases per 100 full-time workers. Industries in Maryland State government reporting high rates of injury and illness were the Nursing and residential care facilities (19.1), Hospitals (17.0), Correctional institutions (12.1) and Police protection (7.5).
Maryland local government reported 13,500 new cases of injury and illness. This represented an increase over 2015’s count of 11,100 total cases. Local government’s TRC rate also increased in 2016 up to 7.7 from 6.3 in 2015. The total recordable case rate for all U.S local government was 5.0 injuries and illnesses. Industries reporting high rates in Maryland’s local government sector were Police protection (28.7) and Fire protection (14.2).
State and local government collectively reported 6,580 days-away-from-work cases in 2016. Occupations reporting a high number of cases in the public sector were Police and sheriff’s patrol officers (890); Bus drivers, transit and intercity (450); Correctional officers and jailers (440); Firefighters (380); Elementary school teachers, except special education (340); and Janitors, and cleaners, except maids and housekeeping cleaners (300).
Collectively, Maryland State and local government municipalities and agencies employed some 340,300 workers during 2016, based on data from the Maryland Department of Labor, Licensing and Regulations’ Office of Workforce Information and Performance, Quarterly Census of Employment and Wages program.
Chart 1, Total recordable case incidence rates per 100 full-time equivalent workers for all nonfatal workplace injuries and illnesses, Maryland and all U.S. private sector, 1999 - 2016
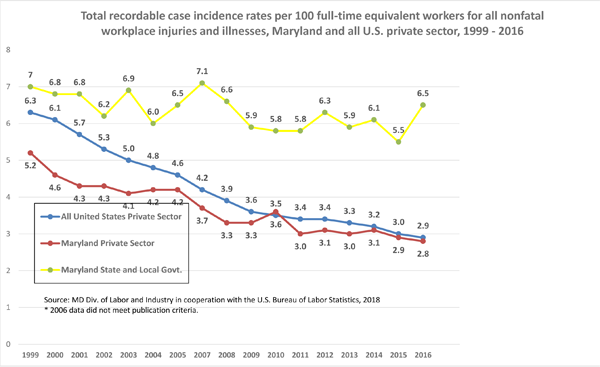
Source: MD DLLR, Division of Labor and Industry in cooperation with the U.S. Bureau of Labor Statistics, 2018
Source: MD DLLR, Division of Labor and Industry in cooperation with the U.S. Bureau of Labor Statistics, 2018
Chart 3. Distribution of DAFW injury and illness cases by event or exposure, private industry, Maryland, 2016 [Total Cases = 18,600]
![Chart 3. Distribution of DAFW injury and illness cases by event or exposure, private industry, Maryland, 2016 [Total Cases = 18,600]](../../images/moshresearchchart32016.png)
Source: MD DLLR, Division of Labor and Industry in cooperation with the U.S. Bureau of Labor Statistics, 2018
Chart 4. Industries with the highest incidence rates of total nonfatal occupational injuries and illnesses, Maryland, 2016
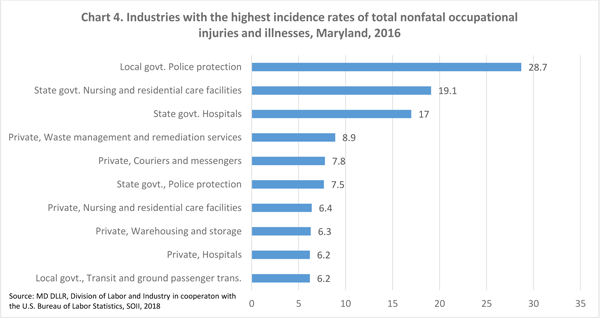
Source: MD DLLR, Division of Labor and Industry in cooperation with the U.S. Bureau of Labor Statistics, SOII Program, 2018
| Maryland Nonfatal Incidence Rates Survey of Occupational Injuries and Illnesses, 2002-2016 |
|||
| Total Recordable Cases (TRC) | Cases with Days Away, Restriction, or Transfer (DART) |
Other Recordable Cases (ORC) | |
| Private industry | |||
| 2016 | 2.8 | 1.5 | 1.3 |
| 2015 | 2.9 | 1.6 | 1.3 |
| 2014 | 3.1 | 1.7 | 1.4 |
| 2013 | 3.0 | 1.5 | 1.5 |
| 2012 | 3.1 | 1.6 | 1.5 |
| 2011 | 3.0 | 1.6 | 1.4 |
| 2010 | 3.6 | 1.9 | 1.7 |
| 2009 | 3.3 | 1.7 | 1.6 |
| 2008 | 3.3 | 1.7 | 1.6 |
| 2007 | 3.7 | 1.9 | 1.8 |
| 2006 | 3.8 | 2.0 | 1.8 |
| 2005 | 4.2 | 2.2 | 2.0 |
| 2004 | 4.2 | 2.3 | 1.9 |
| 2003 | 4.1 | 2.3 | 1.8 |
| 2002 | 4.3 | 2.4 | 1.9 |
| State and local govt. | |||
| 2016 | 6.5 | 3.2 | 3.4 |
| 2015 | 5.5 | 2.8 | 2.7 |
| 2014 | 6.1 | 2.9 | 3.1 |
| 2013 | 5.9 | 2.8 | 3.1 |
| 2012 | 6.3 | 2.8 | 3.6 |
| 2011 | 5.8 | 2.9 | 3.0 |
| 2010 | 5.8 | 3.1 | 2.7 |
| 2009 | 5.9 | 3.0 | 2.9 |
| 2008 | 6.6 | 3.3 | 3.3 |
| 2007 | 7.1 | 3.5 | 3.6 |
| 2006* | - | - | - |
| 2005 | 6.5 | 2.9 | 3.6 |
| 2004 | 6.0 | 3.2 | 2.9 |
| 2003 | 6.9 | 3.9 | 3.0 |
| 2002 | 6.2 | 3.6 | 2.6 |
| All industries including State & local govt. | |||
| 2016 | 3.3 | 1.7 | 1.6 |
| 2015 | 3.2 | 1.7 | 1.5 |
| 2014 | 3.5 | 1.8 | 1.6 |
| 2013 | 3.4 | 1.7 | 1.7 |
| 2012 | 3.5 | 1.7 | 1.8 |
| 2011 | 3.4 | 1.8 | 1.6 |
| 2010 | 3.9 | 2.1 | 1.8 |
| 2009 | 3.7 | 1.9 | 1.8 |
| 2008 | 3.7 | 1.9 | 1.8 |
| 2007 | 4.1 | 2.1 | 2.1 |
| 2006* | - | - | - |
| 2005 | 4.5 | 2.3 | 2.2 |
| 2004 | 4.5 | 2.4 | 2.1 |
| 2003 | 4.5 | 2.5 | 1.9 |
| 2002 | 4.6 | 2.6 | 2.0 |
*2006 data did not meet publication criteria.
Background of the Survey
The Survey of Occupational Injuries and Illnesses (SOII) is a cooperative program between the State of Maryland’s Department of Labor, Licensing and Regulation, Division of Labor and Industry and the U.S. Department of Labor, Bureau of Labor Statistics. SOII provides estimates of the number and frequency (incidence rates) of nonfatal occupational injuries and illnesses by industry code as defined by the 2007 North American Industry Classification System (NAICS) manual. The SOII program also provides details on the circumstances and characteristics of the more seriously injured and ill workers. These injury and illness estimates are based on safety and health logs that, by law, employers are required to keep. Occupational injury and illness statistics have been published for Maryland’s private sector every year since 1972 and for Maryland state and local government from 1979 forward. The SOII program utilizes an employer-based questionnaire to collect occupational injury and illness data. Questionnaires are mailed to a scientifically selected random sampling of businesses in Maryland. The responses are compiled, tabulated and published annually.
Statistical sampling techniques are used to produce the estimates. Because the results are based on a random sampling of establishments in the universe file (the universe is all operating in-scope establishments in Maryland’s unemployment insurance tax file), the estimates probably differ from the figures that would be obtained if every establishment in the State had participated. To determine the precision of each data estimate, a standard error is calculated. The standard error defines a range (confidence interval) around each estimate. Relative standard errors are calculated for every SOII estimate produced.
The quality of the data is dependent on the employer’s understanding of which cases are recordable under the Occupational Safety and Health Administration’s recordkeeping regulation. Maryland State agencies and all local government municipalities and jurisdictions are required by law to keep records of occupational injuries and illnesses. Additionally, many private sector establishments are required to keep injury and illness records. In order to have a complete picture of the occupational injury and illness experience for the economy, many establishments normally exempt from OSHA’s recordkeeping requirements are included in the survey. The OSHA recordkeeping system is designed to measure the incidence, rather than the prevalence, of occupational injury and illness. Prevalence measures capture all injuries and illnesses that occur in a given year including ongoing or unresolved cases from previous years. The intent of the OSHA recordkeeping system is to measure each occupational injury and illness only once. The SOII, therefore, provides estimates of the number and rate of only new injuries and illnesses in a given year.
Excluded from the SOII are the self-employed, farming operations with fewer than 11 employees, private households and federal government agencies. Occupational injury and illness data for coal, metal and nonmetal mining, and for railroad activities were provided by the U.S. Department of Labor’s Mine Safety and Health Administration and the U.S. Department of Transportation’s Federal Railroad Administration, respectively.
Collecting occupational illness statistics remains a challenge with the true number and rate difficult to measure. Unlike injuries, which result from sudden, acute events that are easily observed, reported and documented, many types of occupational disease are not diagnosed until long after the initial exposure to workplace carcinogens or other toxins have taken place. It may be years before the cumulative effects of these exposures present as occupational disease and the employee may no longer be in the workforce. Because of this, it is believed the incidence of certain long-term, latent forms of occupational disease is understated by the SOII. The overwhelming majority of the reported illness cases are those that are easier to directly relate to the workplace such as contact dermatitis or carpal tunnel syndrome. The Bureau of Labor Statistics’ Survey of Occupational Injuries and Illnesses is the U.S government’s primary source for charting the nature and magnitude of the occupational injury and illness problem across the country.
All statements of comparison made in this release were found to be statistically significant at the 95 percent confidence level. View additional information regarding background and methodology of the Bureau of Labor Statistics’ Survey of Occupational Injuries and Illnesses.
Nonfatal Data
- Table 1. Number of nonfatal occupational injuries and illnesses involving days away from work by selected worker characteristics and major industry sector, private industry, Maryland, 2016
- Table 2. Percent distribution of nonfatal occupational injuries and illnesses involving days away from work by selected worker characteristics and major industry sector, private industry, Maryland, 2016
- Table 3. Number of nonfatal occupational injuries and illnesses involving days away from work by major occupational group and major industry sector, private industry, Maryland, 2016
- Table 4. Number of nonfatal occupational injuries and illnesses involving days away from work by selected worker occupations and major industry sector, private industry, Maryland, 2016
- Table 5. Number of nonfatal occupational injuries and illnesses involving days away from work by selected injury or illness characteristics and major industry sector, private industry, Maryland, 2016
- Table 6. Incidence rates of nonfatal occupational injuries and illnesses by industry and case types, Maryland, 2016
- Table 7. Numbers of nonfatal occupational injuries and illnesses by industry and case types, Maryland, 2016
- Table 11. Incidence rates of nonfatal occupational injuries and illnesses by industry sector and case types, 2014-2016, Maryland
Fatality Data
- Table A-1. Fatal occupational injuries by industry and event or exposure, Maryland, 2016
- Table A-2. Fatal occupational injuries resulting from transportation incidents and homicides, Maryland, 2016
- Table A-3. Fatal occupational injuries to private sector wage and salary workers, government workers, and self-employed workers by industry, Maryland, 2016
- Table A-4. Fatal occupational injuries by primary and secondary source of injury by major private industry sector, Maryland, 2016
- Table A-5. Fatal occupational injuries by occupation and event or exposure, Maryland, 2016
- Table A-6. Fatal occupational injuries resulting from transportation incidents and homicides by occupation, Maryland, 2016
- Table A-7. Fatal occupational injuries by worker characteristics and event or exposure, Maryland, 2016
- Table A-8. Fatal occupational injuries by event or exposure and age, Maryland, 2016
- Table A-9. Fatal occupational injuries by event or exposure and major private industry sector, Maryland, 2016
1 Employment data derived from the Maryland Department of Labor, Licensing and Regulation, Office of Workforce Information and Performance, Quarterly Census of Employment and Wages Program, 2016.
Division of Labor and Industry
Maryland Occupational Safety and Health (MOSH)
10946 Golden West Drive,
Suite 160
Hunt Valley, MD 21031
Phone: 410-527-4499
Fax: 410-527-4481
e-mail: [email protected]
Directions to the Hunt Valley Training Center
Select the MD Statistical Information for a calendar year:
- Maryland Statistical Information 2023
- Maryland Statistical Information 2022
- Maryland Statistical Information 2021
- Maryland Statistical Information 2020
- Maryland Statistical Information 2019
- Maryland Statistical Information 2017
- Maryland Statistical Information 2016
- Maryland Statistical Information 2015
- Maryland Statistical Information 2014
- Maryland Statistical Information 2013
- Maryland Statistical Information 2012
- Maryland Statistical Information 2011
- Maryland Statistical Information 2010
- Maryland Statistical Information 2009